
1. Decision summary: what 200W can tell you
Start with the operating point, then qualify a particular motor, drive and gearhead. The calculator is an estimate for comparing configurations. Its amber status means manufacturer verification is still required.
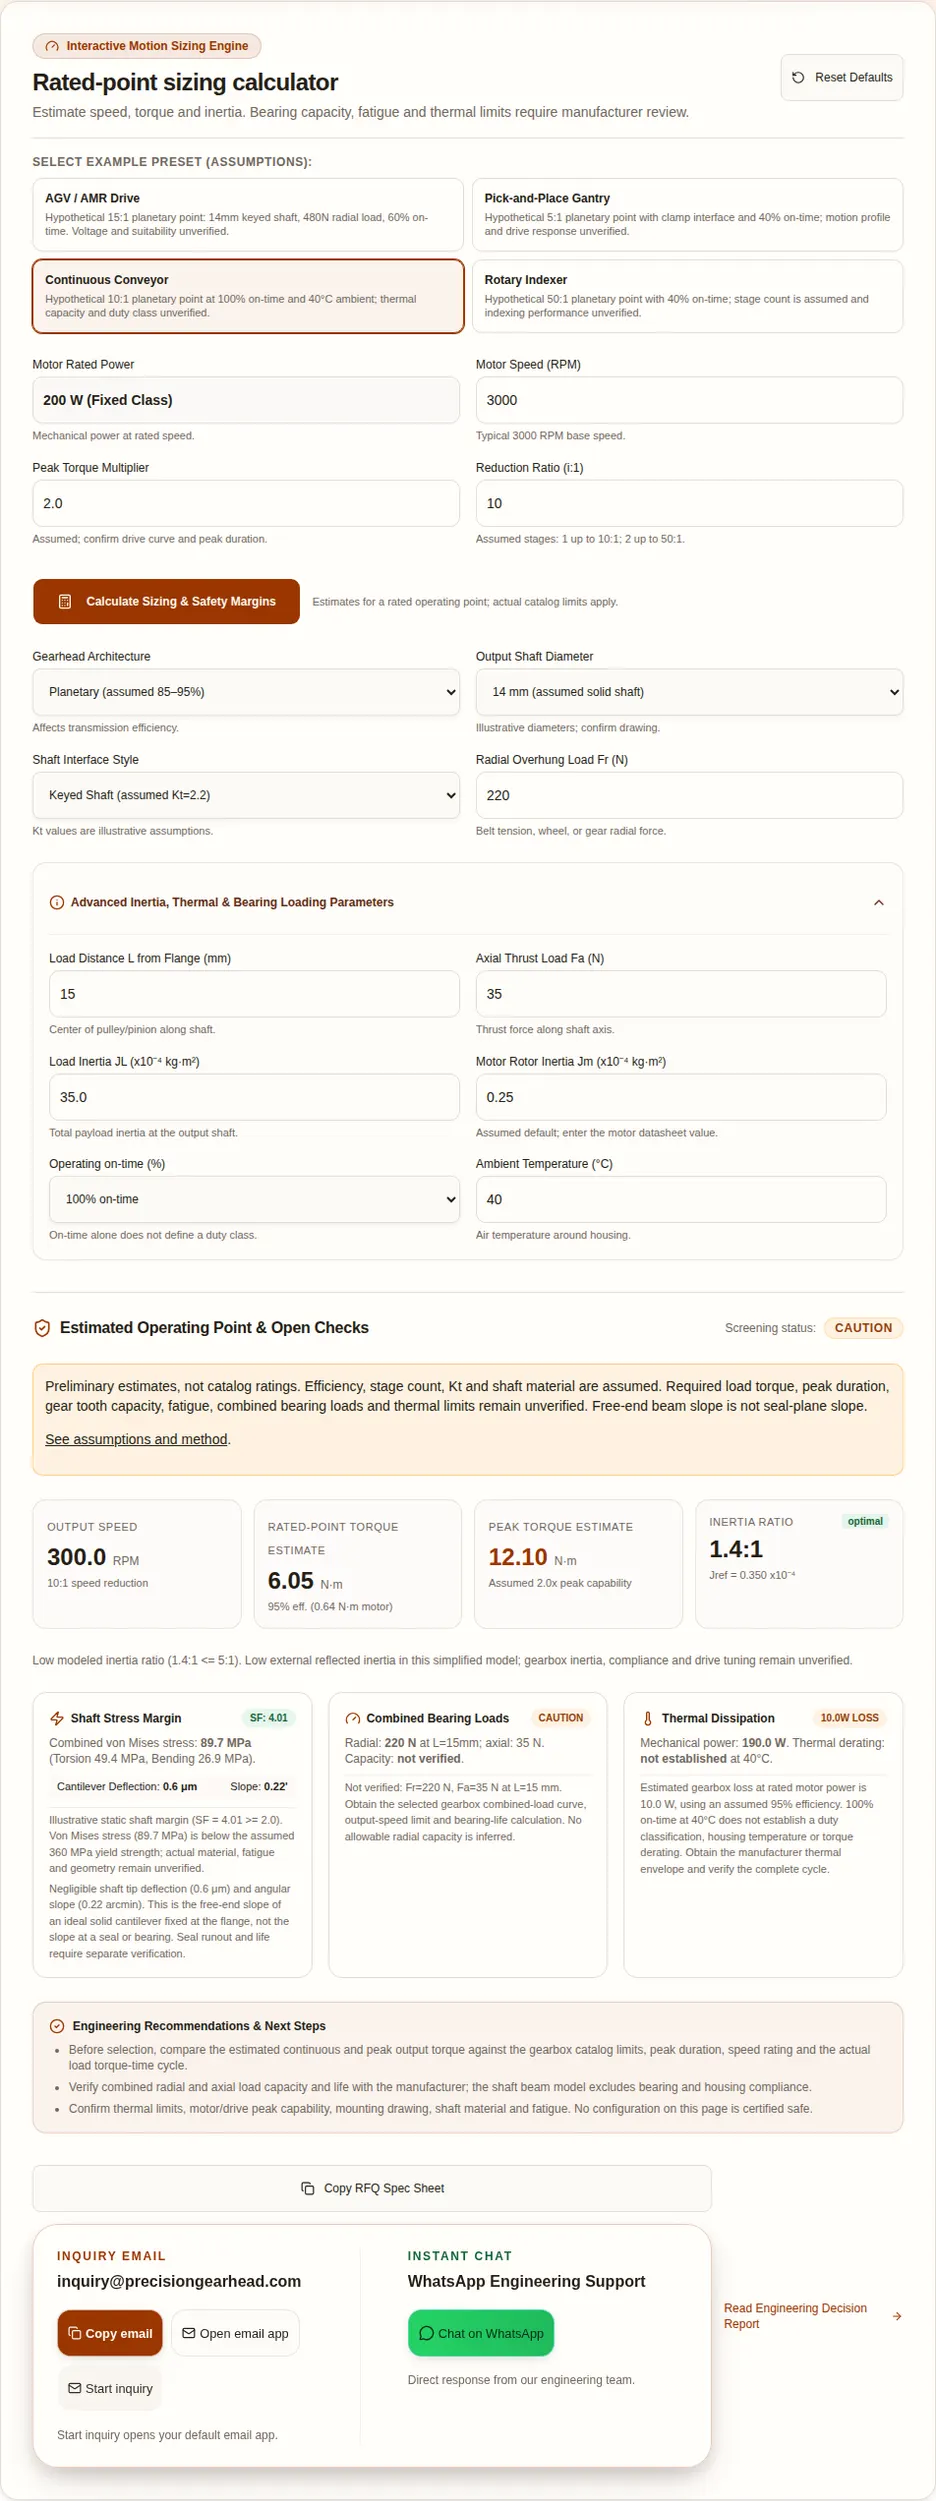
- Power is not a torque rating. At 3000 RPM, 200W gives 0.637 N·m at the motor shaft. The 10:1 example gives 6.05 N·m only with the assumed 95% efficiency. See the derivation below and a documented 200W motor example.
- Ratio trades speed for torque and inertia reduction. A 15:1 ratio gives 200 RPM and divides external load inertia by 225. Selection formula and limits.
- Bearing capacity remains unknown. Shaft diameter cannot replace a model-specific speed/load-position curve. APEX catalog method.
- Low beam deflection does not prove seal life. Check actual runout, alignment and seal geometry. SKF seal analysis.
2. Method, units and assumptions
Motor power is mechanical power at the rated operating point. P = Tω and ω = 2πn/60 give T = 9549 × P(kW) / n(RPM). Output speed is n/i and estimated output torque is T × i × η. Peak torque multiplies this by the entered peak factor; no duration or gearbox rating is inferred.
For the solid-shaft proxy, bending stress σb = 32 × Fr × L × Kt / (πd³), torsional shear τ = 16 × Tpeak × Kt / (πd³), and σvm = √(σb² + 3τ²). Use N, m and N·m to obtain Pa; divide by 10⁶ for MPa. Static yield margin is the assumed 360 MPa / σvm. These equations exclude axial stress, fatigue and the actual bearing support.
| Item | Assumption used | Required before approval |
|---|---|---|
| Efficiency / stages | Planetary: 95% / 1 stage at i≤10; 91% / 2 at i≤50; 85% / 3 above 50. Other architectures: fixed illustrative efficiencies. | Actual catalog efficiency map, available ratio and stage count; APEX AB lists 100:1 as two stages, showing why model bands must not be treated as specifications |
| Shaft | Solid round cantilever; E=206 GPa; yield=360 MPa; Kt=1.2–2.2 illustrative | Actual material, section, fatigue, bearing spacing and housing compliance |
| Inertia | External output inertia / i², divided by rotor inertia; both entered in 10⁻⁴ kg·m² | Gearbox/coupling inertia, acceleration torque and tuning |
| Thermal / bearing | Loss estimate only; capacity and derating unknown | Complete cycle, mounting, ambient and manufacturer load/thermal limits |
3. Read the calculation chain
Changing rated RPM assumes a different 200W rated operating point, not constant-power operation of one motor at any speed.
At 10:1 and η=0.95, the 3000 RPM example gives 300 RPM and 6.05 N·m; actual gearbox limits apply.
Example: JL=35, i=10 and Jm=0.25 gives 1.4:1, with inertias entered in 10⁻⁴ kg·m².
σvm = √(σb² + 3τ²). A static margin excludes fatigue and actual gear tooth capacity.
A heat generation estimate cannot establish surface temperature without heat transfer and installation data.
This geometric allowance excludes torsional compliance, runout and control error.
Available stage count and ratio partitioning are manufacturer specific; the model uses simplified bands.
δ=Fr L³/(3EI), θ=Fr L²/(2EI), I=πd⁴/64. Free-end slope is not slope at the seal.
No universal 60mm or NEMA frame compatibility, ISO fit class or shaft runout is inferred from the power rating.
A resistor value cannot be chosen from the 200W motor rating alone. Use the drive manufacturer’s braking guidance.
No lubricant temperature range, cleanroom approval or relubrication interval is assumed without the product specification.
4. Compare ratios, architectures and evidence
Calculated rows use 200W at 3000 RPM and a 2.5x peak assumption. They are not catalog ratings. High ratios can exceed gearbox torque capacity even when the motor has only 200W.
| Ratio :1 | Assumed stages | Assumed η | RPM | Rated-point N·m | Peak estimate N·m |
|---|---|---|---|---|---|
| 3 | 1 | 95% | 1000 | 1.81 | 3.63 |
| 5 | 1 | 95% | 600 | 3.02 | 6.05 |
| 10 | 1 | 95% | 300 | 6.05 | 12.10 |
| 15 | 2 | 91% | 200 | 8.69 | 17.38 |
| 30 | 2 | 91% | 100 | 17.38 | 34.76 |
| 50 | 2 | 91% | 60 | 28.96 | 57.93 |
| 100 | 3 | 85% | 30 | 54.11 | 108.22 |
| Architecture | Model η | Decision tradeoff | Confirm |
|---|---|---|---|
| Inline planetary | 85–95% | Compact coaxial layout; ratio and stiffness matter | Actual backlash, inertia, torque, speed and efficiency |
| Right-angle hypoid / bevel | 90% | Can help packaging; adds angle-drive cost and losses | Actual hypoid or bevel design, lubrication and load limits |
| Parallel spur | 85% | Alternative shaft layout and transmission design | Actual stage efficiency and reversing lost motion |
| Strain-wave | 70% | Consider for reduction and positioning needs | Available ratio, hysteresis, compliance and fatigue rating |
| Reference | Known from linked source | Unknown for your assembly |
|---|---|---|
| Oriental Motor BMU manual [source below] | Manual §13.3 (p.42): 200W, 3000 RPM, 0.637 N·m rated and 1.15 N·m instantaneous peak; these are motor-shaft values | Selected motor/drive/gearhead combination and mounting suitability |
| APEX AB engineering data [source below] | Uses model-, speed- and load-position-specific data | Applicable radial/axial rating until size, ratio, speed and position are chosen |
| Oriental Motor BLH lineup [source below] | Checked US lineup lists 15–100W | No verified BLH5200 200W pairing; do not substitute it for BMU |
Evidence reviewed 11 November 2026. No cross-brand interchangeable torque, backlash, shaft diameter or radial capacity is claimed. BMU manual · APEX catalog · BLH lineup.
5. Risks, costs and mitigations
| Risk | Trigger / consequence | Action or alternative |
|---|---|---|
| Torque or fatigue overload | Peak multiplier or a high ratio exceeds actual ratings | Obtain torque-time cycle and catalog limits; change ratio, frame size or motion profile |
| Overhung / axial load | Wheel or belt load overloads bearings; free-end beam model misses support deformation | Request combined-load life check; move load inward or use external support |
| Thermal accumulation | Long loaded runs, enclosure or warm ambient | Verify manufacturer thermal envelope and mounting; consider improved conduction or another frame |
| Positioning mismatch | Backlash and compliance exceed the required lost motion | Set an error budget; evaluate lower backlash, output feedback or direct drive |
| Assembly and sourcing cost | Adapter, brake, support bearing or premium accuracy increases cost and lead time | Get a drawing-based quote including accessories and lifecycle maintenance |
| Vertical / regenerative motion | Gravity or deceleration requires holding and energy management | Use an application-specific brake and drive review; power class alone is insufficient |
6. Thermal and duty boundaries
At 95% assumed efficiency the estimated gearbox loss is 10W; at 91% it is 18W. These values exclude motor/drive losses, no-load losses and efficiency variation. Neither a housing temperature nor a permissible torque derating factor is calculated.
On-time percentage does not describe starting, braking, cycle duration or cooling. Supply the full torque-speed-time cycle and check the selected manufacturer’s mounting and duty requirements. BMU operating requirements. A gearbox with lower efficiency may require a different mounting or duty solution; request thermal evidence before committing to it.
7. Reproducible application examples
These are hypothetical operating points, not measured customer case studies. Each uses the same validated inputs and equations as the tool. No service life, housing temperature, settling time, savings or load-carrying approval is claimed.
AGV / AMR Drive
200W at 3000 RPM; 15:1 planetary; η=91% assumed; peak factor 2.5x. Shaft Ø14mm, keyed; Fr=480N at L=18mm; Fa=50N. JL=120, Jm=0.25 (10⁻⁴ kg·m²); on-time 60%, ambient 30°C.
200 RPM · 8.69 N·m rated-point estimate · 21.72 N·m peak estimate · 2.13:1 inertia ratio · 18.0W estimated loss.
Next: select this preset in the calculator, then request bearing, torque-cycle and thermal verification. For vertical motion, add holding-brake review; for a wheel, add shock-load and support review.
Pick-and-Place Gantry
200W at 3000 RPM; 5:1 planetary; η=95% assumed; peak factor 3x. Shaft Ø14mm, clamp; Fr=90N at L=12mm; Fa=25N. JL=5, Jm=0.25 (10⁻⁴ kg·m²); on-time 40%, ambient 25°C.
600 RPM · 3.02 N·m rated-point estimate · 9.07 N·m peak estimate · 0.80:1 inertia ratio · 10.0W estimated loss.
Next: select this preset in the calculator, then request bearing, torque-cycle and thermal verification. For vertical motion, add holding-brake review; for a wheel, add shock-load and support review.
Continuous Conveyor
200W at 3000 RPM; 10:1 planetary; η=95% assumed; peak factor 2x. Shaft Ø14mm, keyed; Fr=220N at L=15mm; Fa=35N. JL=35, Jm=0.25 (10⁻⁴ kg·m²); on-time 100%, ambient 40°C.
300 RPM · 6.05 N·m rated-point estimate · 12.10 N·m peak estimate · 1.40:1 inertia ratio · 10.0W estimated loss.
Next: select this preset in the calculator, then request bearing, torque-cycle and thermal verification. For vertical motion, add holding-brake review; for a wheel, add shock-load and support review.
Rotary Indexer
200W at 3000 RPM; 50:1 planetary; η=91% assumed; peak factor 2.5x. Shaft Ø16mm, clamp; Fr=160N at L=15mm; Fa=120N. JL=320, Jm=0.25 (10⁻⁴ kg·m²); on-time 40%, ambient 25°C.
60 RPM · 28.96 N·m rated-point estimate · 72.41 N·m peak estimate · 0.51:1 inertia ratio · 18.0W estimated loss.
Next: select this preset in the calculator, then request bearing, torque-cycle and thermal verification. For vertical motion, add holding-brake review; for a wheel, add shock-load and support review.
8. Deflection and positioning allowances
For an ideal 300N radial load, a solid shaft fixed at the flange and E=206 GPa, the table below is computed directly from δ=Fr L³/(3EI). Doubling distance multiplies deflection by eight; this does not model the actual bearing/housing system.
| L (mm) | Ø12mm | Ø14mm | Ø16mm | Ø19mm |
|---|---|---|---|---|
| 5 | 0.1 | 0.0 | 0.0 | 0.0 |
| 10 | 0.5 | 0.3 | 0.2 | 0.1 |
| 15 | 1.6 | 0.9 | 0.5 | 0.3 |
| 20 | 3.8 | 2.1 | 1.2 | 0.6 |
| 25 | 7.5 | 4.0 | 2.4 | 1.2 |
| 30 | 12.9 | 7.0 | 4.1 | 2.0 |
At a 30mm pitch radius, 5 arcmin backlash gives 30 × 5 / 3437.75 = 0.0436mm (43.6μm) geometric lost motion. Add compliance, runout and feedback error to build a total error budget. The calculator’s 15/40μm and 3.5/6 arcmin bands are illustrative thresholds, not seal standards or accuracy guarantees. Seal behavior requires its own review.
9. Questions by decision type
Sizing & motion
How much torque does a 200 watt brushless gearhead produce?
200W is motor mechanical power, not gearbox torque. At a rated 3000 RPM, T = P / omega gives 0.637 N·m. A 10:1 gearbox at an assumed 95% efficiency gives 300 RPM and 6.05 N·m. Check the gearbox torque limit separately.
Does a 2.5x peak multiplier apply to every 200W motor?
No. It is an editable assumption. Use the selected motor and drive peak-current curve, permitted peak duration and gearbox acceleration torque rating before specifying a peak output.
How does gear ratio change reflected inertia?
External inertia at the output is reflected to the motor as JL / i². Divide this by motor rotor inertia for the displayed ratio. Gearbox inertia, couplings and compliance are excluded, so this ratio does not prove control stability.
Is an inertia ratio below 10:1 a guaranteed pass?
No. The 5:1, 10:1 and 20:1 bands are illustrative screening bands. Check the drive guidance, acceleration torque, mechanical resonance and settling measurements for the actual machine.
Can increasing the ratio always solve an inertia problem?
A higher ratio reduces external reflected inertia but also reduces output speed and increases estimated output torque. Recheck the required speed, available ratio, gearbox torque rating, gearbox inertia and cycle time together.
Is 200W available at every speed in the calculator?
Each calculation is a separate motor rated operating point. Changing rated RPM assumes the motor supplies 200W at that RPM; it does not describe the speed curve of one motor. Below base speed, use that motor’s torque limit rather than assuming constant power.
Mechanics & interfaces
What is the radial load limit of a 14mm shaft?
Shaft diameter alone cannot establish a bearing or gearbox radial load limit. Request the selected model’s radial and axial combined-load curves at the actual output speed, load position and target life. The tool deliberately leaves capacity unverified.
Where is the calculated shaft slope measured?
It is the free-end slope of an ideal solid circular cantilever fixed at the flange. It is not slope at the seal or bearing. Actual bearing spacing, housing compliance and seal position are needed for those displacements.
Does DIN 3760 impose the tool’s 3.5 or 6 arcmin thresholds?
No universal DIN angular limit is claimed here. These values are illustrative screening bands. Seal suppliers specify permissible runout and misalignment for particular seal designs and operating conditions.
Does a static shaft safety factor prove fatigue life?
No. The calculation uses an assumed 360 MPa yield strength and an illustrative stress concentration factor. Material treatment, actual notches, load reversals, surface finish and fatigue endurance need a separate design check.
Can the solid-shaft model validate a flange or hollow shaft?
No. A flange selection shows only an equivalent solid-diameter illustration. Hollow sections, bolt preload, bolt circle, flange bending and actual bearing support require their own calculation.
Is a clamping hub always better than a keyway?
A smooth shaft can reduce notch effects, but clamp slip torque, surface condition, bore tolerance and assembly torque must be checked. The tool’s Kt values are comparison assumptions, not values supplied by DIN 6885.
Thermal & drive
How much heat does a 200W gearbox generate?
At the assumed rated input, gearbox loss is 200 × (1 − efficiency). At 95% it is 10W; at 91% it is 18W. These are loss estimates, not housing temperatures, and exclude motor and driver losses.
Does 40% on-time establish S5 duty?
No. Duty classification also depends on the load-time sequence, starting, braking, cycle duration and thermal behavior. Supply the complete cycle; the on-time percentage alone cannot establish permissible overload.
What temperature derating should I apply?
Use the manufacturer’s ambient, mounting and thermal torque envelope. This tool cannot derive a universal derating factor or housing temperature from efficiency, on-time and ambient temperature alone.
Is supply current the same as motor phase current?
No. DC input current can be estimated from electrical input power divided by bus voltage; phase current also depends on torque constant, modulation and the drive’s RMS or peak convention. Use the selected motor/drive specifications.
Can a generic braking resistor be specified from 200W?
No. Compute the energy of the full load and motion cycle, then use the drive manufacturer’s braking circuit limits, resistance range, peak power, energy and average power ratings. The motor power class alone is insufficient.
Selection & sourcing
Are the application examples measured customer case studies?
No. They are hypothetical, reproducible operating points calculated with the same model as the tool. They contain no measured life, temperature, accuracy, savings or application approval.
How do I convert backlash into a linear allowance?
At radius r, lost motion is approximately r × angle_arcmin / 3437.75. At a 30mm radius, 5 arcmin corresponds to 43.6μm. This excludes compliance, runout and control error and is not a total accuracy specification.
What should I send with a gearhead RFQ?
Send motor and drive part numbers, rated and peak torque with duration, ratio, required output speed and load torque cycle, radial/axial forces and positions, target life, mounting drawing, shaft interface, ambient conditions, backlash and accuracy needs. Include the tool summary as preliminary estimates.
10. Sources and uncertainty register
Reviewed . Manufacturer documents apply to their own products; they do not certify this calculator. Kinematic and beam values are calculated examples. No measured performance dataset is used. Review this guide every six months or when a linked manufacturer specification changes; update the review date only after checking the content.
- Oriental Motor BMU 200 / 300 / 400 W operating manual
A documented 200W motor example; consult its specifications, duty and installation requirements. This is not a universal 200W rating.
- Oriental Motor: calculating load inertia
External load inertia reflects through the square of the gear ratio. Acceptable inertia depends on the motor and motion profile.
- APEX Dynamics AB engineering data
Model-specific torque, speed and load data; permissible radial load depends on output speed and load position. Use the selected size and ratio.
- SKF: Seal analysis pays
Seal performance depends on shaft-to-bore misalignment and dynamic runout. This source does not establish a universal angular seal limit.
- Oriental Motor BLH product lineup
The checked US lineup lists 15–100W. It is not evidence for the previously claimed BLH5200 200W pairing.
Not established here: catalog load capacity, fatigue life, universal DIN seal angular limits, ISO fit tolerances, lubricant life, thermal derating, drive braking resistance or interchangeability across manufacturers. Obtain current part-specific documents and written confirmation.
11. Prepare a reviewable RFQ
Copy the calculator summary and add motor/drive part numbers, actual required load torque and speed, peak duration, complete cycle and target life. Attach a drawing with pilot diameter, bolt pattern, shaft/bore tolerances, load position and bearing support. Specify ambient conditions, brake, backlash and accuracy requirements.
If inputs are unknown, send the drawing and motion description first. Ask for a configuration and the missing rating checks. The estimate is a starting point for that review.
Inquiry Email
Start inquiry opens your default email app.
12. Selection playbook
- Confirm 200W mechanical rated point, motor speed and drive capability.
- Choose a ratio for required output speed; estimate torque with explicit efficiency.
- Compare actual required load torque, peak duration and cycle against motor and gearbox ratings.
- Verify combined forces, bearing life, shaft geometry and fatigue using the assembly drawing.
- Check thermal envelope, fitment, lost motion, brake and regeneration needs.
- Obtain a documented configuration, quote and application verification before ordering.